Pricing Value Maps: A Value-Based Approach to Pricing Decisions
At Firefly Analytica, we believe in the magic of data-driven insights that truly resonate with human sensibilities. In this article, we will be introducing a remarkable tool, often underutilized but immensely valuable for FMCG products and beyond - Pricing Value Maps.
In the world of pricing strategy, it's not just about numbers; it's about understanding the human perception of value. A buyer's willingness to pay (WTP) is intricately connected to how they perceive the value of a product. Value maps allow us to visualize this connection, providing us with valuable insights.
Pricing should be a reflection of the value a customer sees in a product. By mapping your brand's offerings and those of your competitors against the dimensions of value and WTP, you can unlock powerful positioning insights. This leads to better pricing strategies, the identification of product advantages, and the ability to anticipate market movements.

Components of a Pricing Value Map
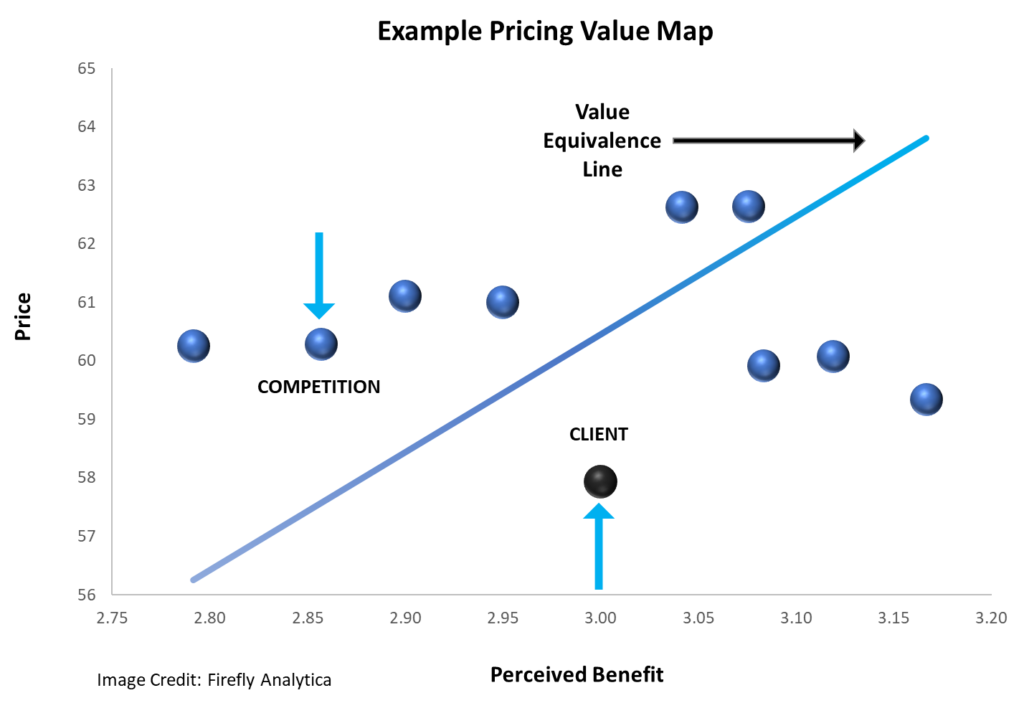
Value maps are a fascinating canvas where data comes to life. Let's take a closer look at how to read them:
- The Perceived Benefit (Horizontal (x) Axis): This represents the numerical value of how consumers perceive the "benefit" of a product such as taste, nutritional value, packaging, convenience, etc. It's derived from consumer responses, reflecting the importance of various product benefits and how they perceive each product's performance on these benefits.
- The Price (Vertical (y) Axis): This axis displays the known or actual prices of each product. It can be based on various sources like POS data, online pricing, or consumer surveys. The choice of pricing data is crucial for meaningful comparisons.
- The Value Equivalence Line (VEL): This diagonal line represents the hypothetical "fair" tradeoff between price and value. In an ideal world, every offering would align with the VEL, indicating that consumers believe they get what they pay for. But in reality, markets often deviate from this line, especially in highly differentiated markets.
Interpreting the Pricing Value Map
In the example, we see the client's product positioned below and to the center-right of the VEL, signifying a "Value Advantaged" position. Customers get more value than they pay for. The question arises - should the price be higher to capture more of this value? On the other hand, some competitors are positioned above the VEL in the "Value Disadvantaged" area, implying they offer less value for the price relative to the market's VEL.
Unlocking the Potential of Pricing Value Maps
In the world of FMCG, value maps have a profound impact on strategy development, product design, pricing decisions, and go-to-market strategies. These maps steer the focus toward benefits, perception, quantification, and finding the right prices to harvest those benefits.
Moreover, value maps open the door to a dynamic view of the value proposition, acknowledging that consumer perceptions and behaviors are in a constant state of flux. The best part about Value maps is that they can be enhanced to provide more tailored insights.
At Firefly Analytica, we're dedicated to helping you embrace the art and science of value maps. Let's embark on this journey together to create pricing strategies that truly resonate with your customers.
Get in touch with us at info@fireflyanalytica.com